Dashboard
Analytical Information and Statistics
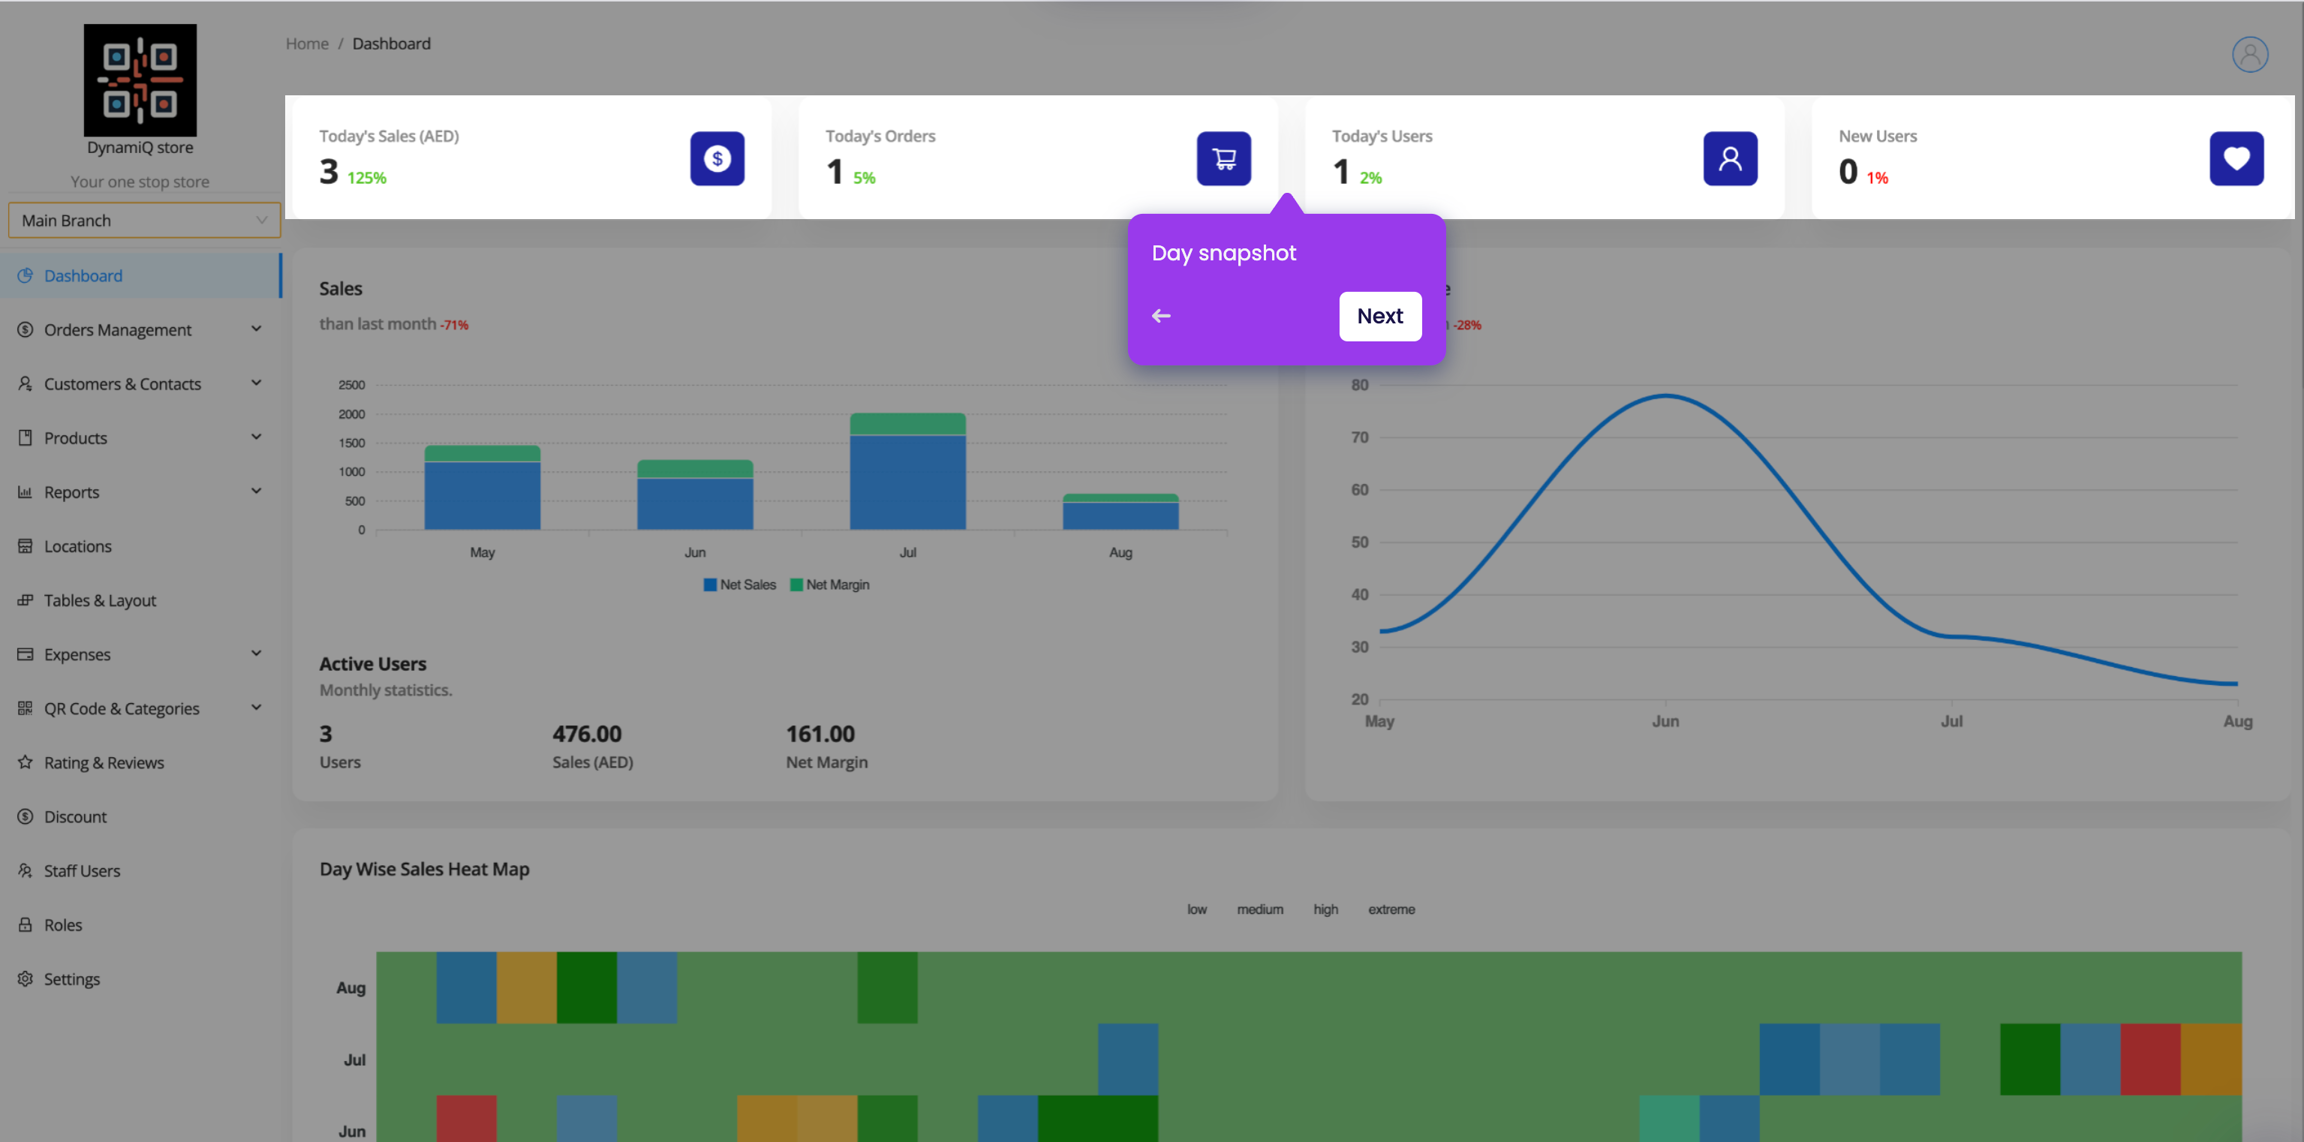
The dashboard is the first page you see when you log in to the application. It provides an overview of the most important information and statistics.
The dashboard is divided into several sections:
Summary of the most important statistics, such as total sales, revenue, and orders.
Chart showing the sales and margins month on month.
Chart showing the number of orders over time.
Daywise Sales Heatmap
Heatmap showing the sales volume by day of the month.
Peaktime Sales Heatmap
Heatmap showing the sales volume by time of the day.
List of the top 10 products by revenue.
Customers Statistics
Chart showing the number of customers over time. New customers, returning customers, active customers, ordering customers and signed up customers.
Sales by Channel
Chart showing the sales volume by channel.
Chart showing the payments volume by payment method.
To access the dashboard, click on the Dashboard link in the sidebar. You can customize the dashboard by selecting the time period and other options.
The dashboard provides a quick overview of the most important information and statistics, making it easy to track the performance of your business.